HOME
Pythagoras |
MAD |
JEAN PAUL BENZECRI |

The original Greek software DATA ANALYSIS METHODS (-MAD-) was created by the Dr. Dimitrios Nik. Karapistolis, ex. professor of Data Analysis at the ATEI Thessaloniki, now International University of Greece
BACK to the GREEK site OUR MISSION The purpose of this website is to present the following topics in detail: a) The necessity of data analysis methods in the study of populations using samples, without a priori assumptions about the behavior of the phenomenon being examined, as these are highlighted mainly by the French School b) The brief description of the multidimensional factorial methods, i.e. the Factorial Analysis of the Correspondences of the French professor Jean Paul Benzecri, the Ascending Hierarchical Classification based on the FACOR and VACOR algorithms, the Principal Component Analysis, the Rank analysis the Lebart semiometrics, Piron, Steiner, the Factorial Discriminant Analysis based on the Mahalanobis metric, the Hierarchical Analysis and the Inductive Statistics of the French professor Regie Gras, which is presented for the first time in the Greek literature. In addition, you will get to know four new methods which are creations of Dr. Dimitrios N. Karapistoli, a) the BENKAR method,b) the Ascending Hierarchical Classification class evaluation method c) the COMPLEX HIERARCHICAL CLASSIFICATION method and d) the most recent method of GENERALIZED HIERARCHICAL CLASSIFICATION. To get to know the methods follow the link BROWSE/BRIEF PRESENTATION OF DATA ANALYSIS METHODS
c) The processing of evaluation tables
d) Dr. Dimitrios Karapistoli's published papers in international journals and conferences, either as the main author, or in collaboration with other scientists in the Greek, English and French languages, referring to applications of the above methods, for a better understanding of their usefulness.
e) A communication portal of researchers with common interests mainly related to market research methods using multivariate statistical analyses.For more information, follow the link ENTRANCE TO THE GATEWAY.
GATEWAY of DATA ANALYSIS
The necessity of using the methods of Multidimensional Statistical Analysis to solve mainly economic phenomena is evident from the multitude of applications that will be presented on this website. The connection that exists between the principles and laws of Physics and the principles that govern the methods of Data Analysis is also evident, when one looks mainly at the various texts presented.
Here the interested party will find relevant information concerning the methods of multivariate statistical analysis processed by the software MAD version 9.0
Curriculum Vitae

Dr Dimitrios Nik. Karapistolis
Here you can find out about the activities of Professor of Statistics and Data Analysis Dr. Dimitrios Nik. Karapistolis.
He served for 38 years in Higher Education.
During the period 13/12/1976-14/5/1980 he served at the current University of Macedonia in the Department of Statistics and in the period from 15-5-1980 to 31-8-2014 as a professor in the Department of Marketing, Technological Institute of Thessaloniki now the International University of Greece.
Official Web Site MAD
FOUNDER |
logoMAD |
JEAN PAUL BENZECRI |
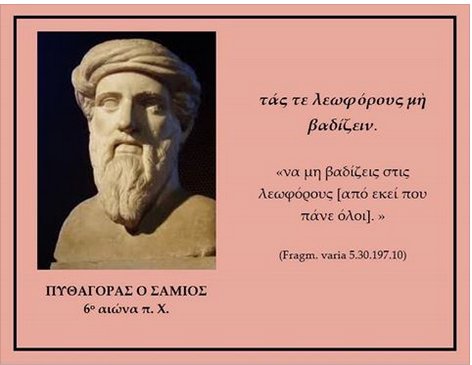
Pythagoras was the founder of the mathematical formulation of the Rn dimensional space through the Pythagorean theorem
The M.A.D (Méthodes d'Analyse des Données) program was created in 1993 by Professor Dr. Dimitrios Nik. Karapistolis as part of his doctoral thesis at the Department of Applied Informatics of the University of MACEDONIA Thessaloniki Greece
Jean Paul Benzecri was the founder of the mathematical formulation of Data Analysis in France through the Factorial Data Analysis method
INSTRUCTIONS FOR THE SOFTWARE M.A.D
The instructions for use accompanying the M.A.D Version 9.0 software introduce the user first to the philosophy of data analysis and management and then with texts and images guide the user to the correct management and interpretation of the results.
Indicative instructions of M.A.D are presented in the video below (in GREEK)
The user can download a trial version IN ENGLISH of the MAD software (version 9.0), fully functional ONLY for the Method of Correspondence Analysis. The software is installed on Windows 10 & 11 environments in conjunction with Office 2007, providing a taste of the capabilities of the full version 9.0
Download demo version 9.0 (file rar 8.18 MB)
For more information look at in the paragraph MAD SOFTWARE CONTENTS
HOW THE M.A.D SOFTWARE IS AVAILABLE
The M.A.D software installed on branded, reliable refurbished (refurbished-grade A-) laptops of branded companies, of high specifications at the price of 600€ when it comes to individual users (24% VAT included). In the special case where the customer wants different characteristics of the laptop, the price is adjusted according to his requirements.
Note: When it comes to companies and in particular the DANSTEV software that concerns the evaluation of its staff, the price is set according to the needs of the company.
LAPTOP TECHNICAL CHARACTERISTICS DELL Latitude. Processor: Core I5,Memory RAM: 8 GB, SSD :256 GB NOTE 1: With every purchase of M.A.D software, FREE on-site training is provided. In any other case after communication by email. NOTE 2: Complete guide is built into the software in the TRAINING process.
MAD SOFTWARE CONTENTS
The program presents FOUR different data management modules (A,B,C,D) and TREE (E,F,G) others of general interest A.FILES B.PROCESSING C.METHODS D.TRAINING E.DIFFERENCE F.MADGroup G.INFORMATION The procedures for each section are described below Α. FILES
1. New file 2. Open file
3.Download external data II.Price control IIΙ.Backup file IV.Delete file V.Emptying a bin or folder ΤΧΤ VI.EXIT
B.PROCESSING
I. ONE DIMENSIONΑL
1.QUANTITATIVE 1.1 Variable analysis 1.2 Tests
1.3 Analysis of variance
1.4 Times series
1.5 Regression
1.6 Correlation
1.7 Non-parametric controls
1.8 Statistical tables Selection distribution
2.POLLS
3.QUALITY
II.MULTIDIMENSIONAL 1. Create a BURT table 2. Calculation of parameters 3. Evaluation of CAH classes 4. Evaluation of analysis results OF chc 4. Evaluation of k tables with identical variables after CHC 5. 3D Tables 6. Semiometrie
7. Distances with the Euclidean metric
8. Quantitative variable p-tables
9.Tables (IxJ) with rating scales
III. Texts 1.Distribution of text words 2.Lexinums
C.METHODS 1. Factor Analysis of Correspondences (-AFC-) 2. Principal Components Analysis (-PCA) 3. Ranks Analysis 4. Ascending Hierarchical Classification 5. Discriminant Factor Analytic Hierarchical Classification 6. Implicative Statistics 7. Hierarchical Analysis 8. Generalized Ascending Hierarchical Classification 9. Method BENKAR 10. Complex Hierarchical Classification
D.TRAINING 1.INSTRUCTIONS FOR USE 2.LESSONS of DATA ANALYSIS 3.EDUCATIONAL FILES
E.DIFFERENCE 1.Calculator 2. Notebook 3.Game of luck 4.Calendar 1900-2100 5.The environment of R
Ε. SYSTEM INFORMATION The user gets various information regarding the creation of the software MAD FAQ
Pythagorean academy
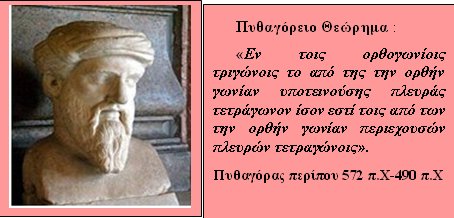
Inspirer: Dr. Dimitrios N. Karapistolis The Pythagorean Academy aims to train researchers who will acquire the appropriate resources to carry out research based on the Pythagorean theorem in combination with the Factorial Analysis of Correspondence method, created by the French professor Jean Paul Benzecri. The main contribution of the Academy in the Greek area consists in bringing together the two basic methods of Factorial Analysis of Correspondences and Ascending Hierarchical Classification, as they are applied by the French School, in a single procedure, the Generalized Ascending Hierarchical Classification with the use of KARAP method, applying the Pythagorean Theorem to the Euclidean n-dimensional vector space Rn Who is pythagoras He is the preeminent founder of Greek mathematics, having created a complete system for the science of celestial bodies, which he supported with all the relevant numerical and geometric proofs. He was also the founder of an initiatory philosophical movement whose members were called Pythagoreans. The Pythagoreans were the chosen students of the inner circle, while there were also students who did not belong to his school but followed him, known as Pythagorists. The difference between them was in terms of spiritual development and self-discipline, with the Pythagoreans being clearly of a higher level as students and Mystics compared to the Pythagorists. Because most of the information was written many centuries after his death, very few reliable details are known about him. Additionally, he had a significant influence on philosophy and religious teachings at the end of the 6th century BC. He is often referred to as a great mathematician and scientist, and he is best known for the Pythagorean Theorem, which bears his name. He was born around 569 BC, with the island of Samos being the most widely accepted birthplace. It is also likely that he traveled extensively when he was young. Around 530 BC, he moved to a Greek colony in southern Italy. His followers adhered to the practices he developed and studied his philosophical theories. The meeting places of the Pythagoreans were burned, and Pythagoras was forced to leave the city. He died at Metapontion in Italian Lucania at the age of 84 in 496 BC. Pythagorean theorem."Ιn a right triangle, the square of the hypotenuse is equal to the sum of the squares of the two perpendicular sides" "Everything is a number" was the motto of the Pythagorean School PYTHAGORIAN TABLE OF PRE-EDUCATION See HERE. LIKERT scalesA proper scale requires response options that cover the full range of attitudes either numerically from 1-5 (or 1-10) or descriptively — from “Strongly disagree” to “Strongly agree” with corresponding A proper scale requires response options that cover the full range of attitudes either numerically from 1-5 (or 1-10) or descriptively — from "Strongly disagree" to "Strongly agree" with corresponding verbal phrasing.<\p>
Most popular question on the PYLIMAD site From GOOGLE SEARCH data it appears that the topic of query processing using scales is the most popular on this site.
DATA ANALYSIS FOR STAFF EVALUATIONe
CONTACTThe website www.pylimad.gr is his personal website Dr. Dimitrios N. Karapistolis Contact the WEBMASTER
In order to reply to the email, the following information must be mentioned in the text that will be prepared, among others:
OUR POSITION Images from the city of THESSALONIKI (Macedonia-Greece)
|


